Data blindness: A contranym affecting data-driven decision making
Data blindness has a couple of definitions, one contradicting
the other. In the first definition, data blindness refers to
having an abundance of data, unstructured with an overload of
information preventing the user from leveraging data to find
valuable information to make decisions.
Data blindness could also mean having little or no
visibility over data and organizations having no idea
regarding how their businesses are functioning, leading them
to make uninformed decisions that could be detrimental to
their functioning.
Irrespective of the definitions, the term can be broadly
stated as mistrust or ill-treatment of data. The two scenarios
mentioned above are cause for concern and prevent any
organization from being data-driven decision-makers.
Indicators of data blindness Confirmation bias:
- Confirmation bias refers to the searching for information and data that fits one’s beliefs. The data justifies the decision rather than the data driving the decision-making. The bias creates a scenario in which the data does not favor the construct and the user laments the data as unreliable instead of focussing on what the data conveys.
- Blindly relying on data tools: Some organizations invest heavily in sophisticated data collection techniques, having an abundance of unstructured data with lots of information but difficult to spot. The unstructured data creates an overload of information, and the focus is on the tools rather than what the outcome the data collection process hopes to achieve.
- Choosing the wrong metrics or focussing on just one metric: Some metrics make your data look favorable, whereas there could be problems that are hiding within the metrics and require additional metrics to get the complete picture
How can you overcome data blindness?
- Start small, and take a step-by-step approach to solve problems with data by using minimal tools and simple digital data collection practices.
- Find your purpose for becoming data-driven and what outcome you want to achieve by becoming data-driven.
- Use simple metrics and data tools in the first step, understand the data, check the quality of the data collected, structure the data, question the data, and figure out what the data shows and why. A simple way to structure a data story is by separating it into the components: The problem, test, and solutions. This structure helps answer why you are collecting the data, what it reveals, and what to do about it.
- Be open-minded and check the data for answers to your outcome questions rather than use the data to try and justify your answers and prejudice.
- Use simple, structured, easy-to-use tools to achieve your data goals, add feedback loops to monitor your goals, and reframe your goals for future improvements. Simple tools will help improve data adoption across your organization, making data accessible to anyone who needs it.

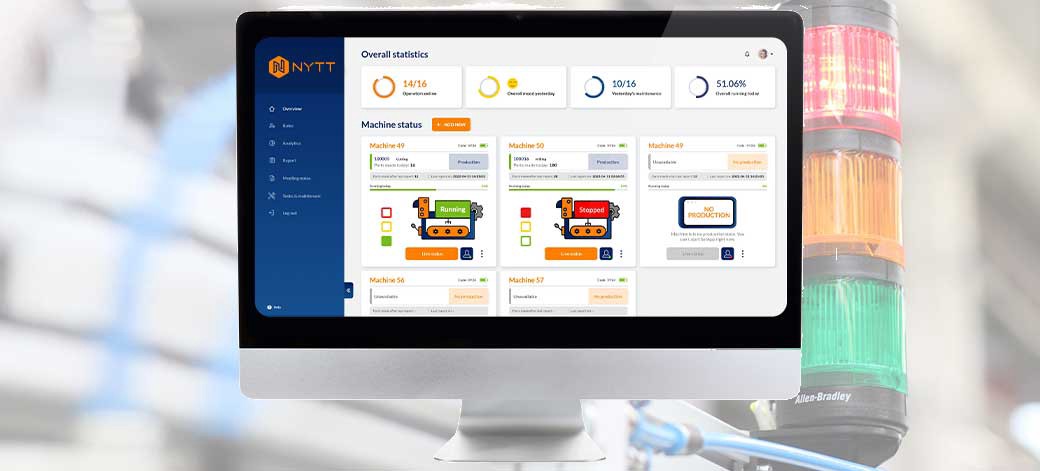
Nytt platform for data visualization and collection using simple tools.
Data-driven decision-making is not only about the tools but also the mindset that you develop. For manufacturing companies that have the attitude to become data-driven, we have developed simple, easy-to-use tools at Nytt to start your journey to become data-driven decision-makers.

